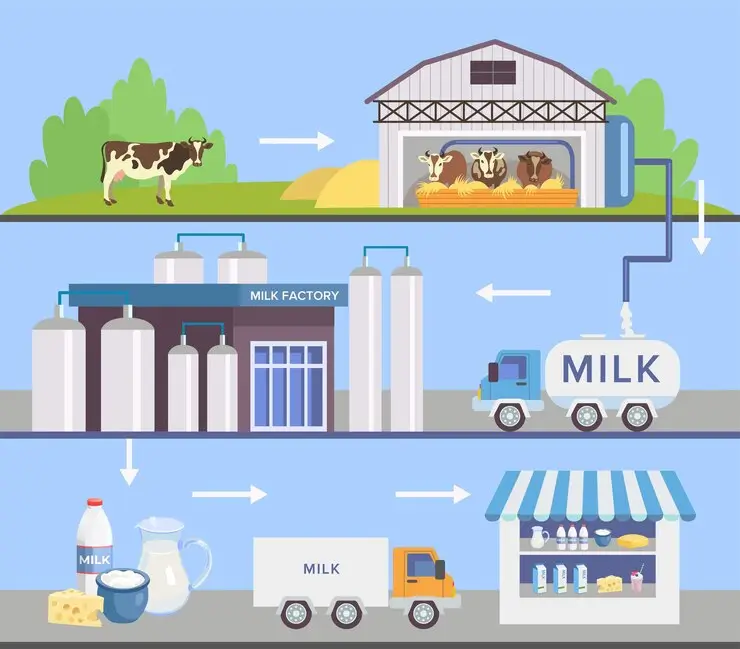
A project report typically includes various essential sections that help provide a comprehensive view of the proposed project. Below are the key components that should be included in a project report, explained in simple terms:
1. Project Synopsis
This section provides a brief overview of the project, including its objectives, scope, and the purpose it intends to achieve. It’s essentially a summary of the entire project.
2. Proprietor Detail
Here, you will provide information about the owner or person in charge of the project. This includes their background, expertise, and role in the project.
3. Executive Summary
This is a concise summary of the entire project report. It covers the main points of the report, including project goals, business operations, market insights, and financial projections, allowing readers to quickly grasp the project’s key elements.
4. Business Profile
This section provides a detailed description of the business, including its history, vision, mission, and objectives. It outlines the type of business and the products or services it offers.
5. Market Analysis
In this section, you will analyze the target market for the product or service. It includes identifying customer needs, market trends, competition, and potential opportunities. It helps to understand the market demand.
6. Production Process
This part describes the process involved in producing the product or delivering the service. It covers the steps, resources, technologies, and manpower needed for production.
7. SWOT Analysis
A SWOT (Strengths, Weaknesses, Opportunities, and Threats) analysis helps identify the internal and external factors that could affect the project’s success. It helps in strategic planning.
8. Fixed Capital Investment
This section provides details about the long-term investments required to start the project. It includes costs for land, machinery, buildings, and equipment that are not easily converted to cash.
9. Working Capital
Working capital refers to the short-term capital needed for day-to-day operations. This section outlines the funds required for inventory, receivables, payables, and other operational expenses.
10. Summary of Project Cost
This part outlines the total costs involved in the project, including both fixed and working capital costs. It provides an estimate of how much money will be needed to complete the project.
11. Projected Depreciation Schedule
Depreciation refers to the reduction in value of assets over time. This section outlines how the depreciation of assets (like machinery and equipment) will be calculated and spread over the project’s life.
12. Cost Statement
This section provides a detailed breakdown of the costs involved in the project. It includes both capital and operational expenses, helping stakeholders understand where the money will go.
13. Projected Profitability Statement
This part shows how profitable the project is expected to be over time. It includes projected revenues, expenses, and profits.
14. Projected Cash Flow Statement
This statement predicts the inflow and outflow of cash throughout the project. It helps to understand how much cash the project will generate or require in the future.
15. Projected Balance Sheet
The balance sheet gives a snapshot of the financial status of the project at a particular point in time. It lists the project’s assets, liabilities, and equity.
16. Loan Repayment Schedule
If the project requires financing, this section outlines the repayment plan for loans, including amounts, timelines, and interest.
17. Computation of Maximum Permissible Bank Finance (MPBF)
MPBF refers to the maximum amount of financing a bank can offer based on the project’s financial health. This section calculates and details this amount.
18. Calculation of Debt-Service Coverage
This calculation assesses the project’s ability to pay its debt. It compares the project’s cash flow with its debt obligations.
19 Ratio Analysis
Ratio analysis helps assess the project’s financial health using different financial ratios. These ratios help in understanding profitability, liquidity, and financial stability.
20. Projected Break-even Point
This section calculates the point where the project’s total costs equal its total revenues. At this point, the project will start making a profit.
21. Project Feasibility Graph
This graph visualizes key financial and operational metrics over time, helping stakeholders understand how the project’s performance will evolve.
22. Assumptions
This section lists the assumptions made while preparing the project report. These could include market conditions, economic factors, or other variables that could impact the project.
23. Conclusion
The conclusion summarizes the overall findings of the project report, presenting a final evaluation of the project’s feasibility and expected outcomes.


